
Vulnerability by Ecosystem, 2020-2026


Crypto hacks do not happen randomly. Some ecosystems are safer, some more dangerous. But raw losses alone do not tell us which ecosystems are becoming safer, which are becoming riskier, or why anything is changing at all.
To understand that, we need to look at DeFi protocol loss rates: exploit-driven losses tied to protocols operating within an ecosystem, measured alongside the scale of value those ecosystems secure over a given epoch.
So I assessed exploit and vulnerability data across major ecosystems from 2020 through 2025. This six-year window captures the full arc of DeFi security to-date: the early flash-loan era of 2020, the explosive growth and mega-exploits of 2021, the bridge catastrophes of 2022, the gradual maturation of 2023, and the diverging trajectories of 2024 and 2025.
Disclaimer: This analysis focuses on DeFi protocol losses, the incidents that actually reflect the security posture of an onchain ecosystem, rather than centralized exchange failures that happen to hold assets on a given chain.
That distinction matters. When Bybit lost $1.5 billion through a multisig phishing exploit in February 2025, the stolen assets were held in Ethereum-based wallets, but the failure was in Bybit’s custody and approval flow, not in Ethereum itself. Likewise, DMM Bitcoin’s $305 million loss in 2024 was a key management failure at the exchange level, not a vulnerability in Bitcoin. Counting those incidents as ecosystem-level security failures would distort the picture, and so for our purposes exchange losses are separated from protocol-level losses to give a clearer view of where ecosystem security actually stands.
Methodology: How We Count Multi-Chain Incidents
This analysis focuses on exploit-driven DeFi protocol losses. It excludes centralized exchange failures from the comparative ecosystem rankings (although really, each exchange is its own ecosystem unto itself), and it excludes fraud and rug pulls unless explicitly discussed for historical context.
A note on attribution: when a single exploit affects multiple ecosystems, the full loss is attributed to each affected ecosystem. If a protocol deployed on six chains is exploited everywhere it runs, users and protocols in all six ecosystems were exposed to the full impact of that exploit.
The tradeoff is that summing per-ecosystem totals will exceed the actual industry-wide amount lost, because multi-chain incidents are counted more than once. We use this approach because it better reflects the risk borne by participants in each ecosystem, even if it overestimates actual impact. Where multi-chain incidents materially shape an ecosystem’s figures, that influence is noted explicitly.
Throughout this report we also express losses relative to each ecosystem’s TVL (total value locked), sourced from DeFiLlama. Because TVL fluctuates significantly month-to-month, we use approximate annual averages rather than point-in-time snapshots. These ratios should be read as directional rather than precise: a chain with a 0.4% loss/TVL ratio is meaningfully safer than one at 6%, but the exact decimal is an estimate.
The Industry-Wide Picture: DeFi Is Getting Safer
The single most important finding is that DeFi protocol security has improved dramatically over six years.
Industry-Wide DeFi Protocol Losses by Year (Unique Incidents)
Unique incident counts (each exploit counted once regardless of how many chains were affected).
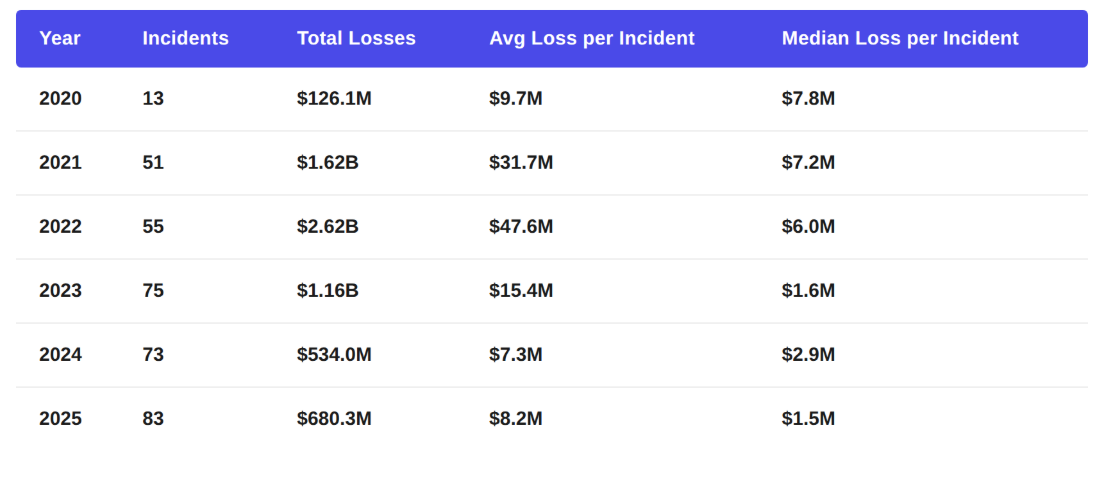
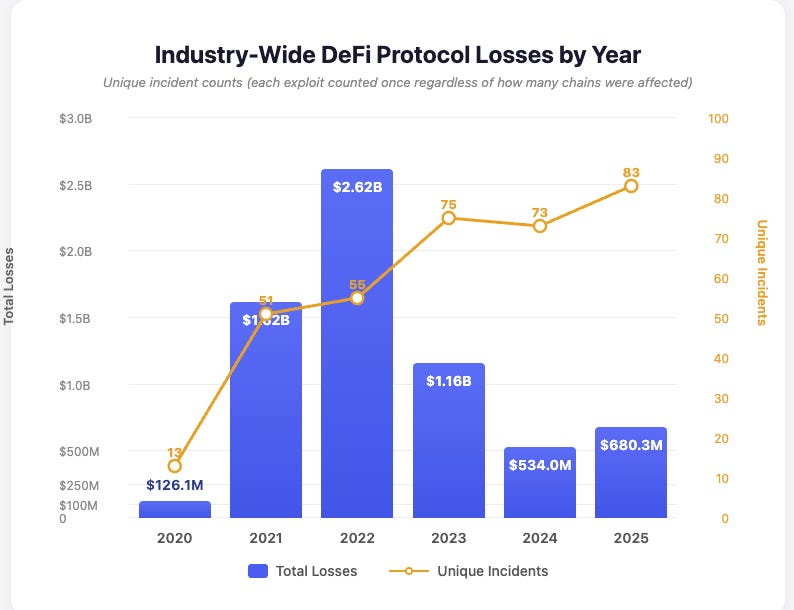
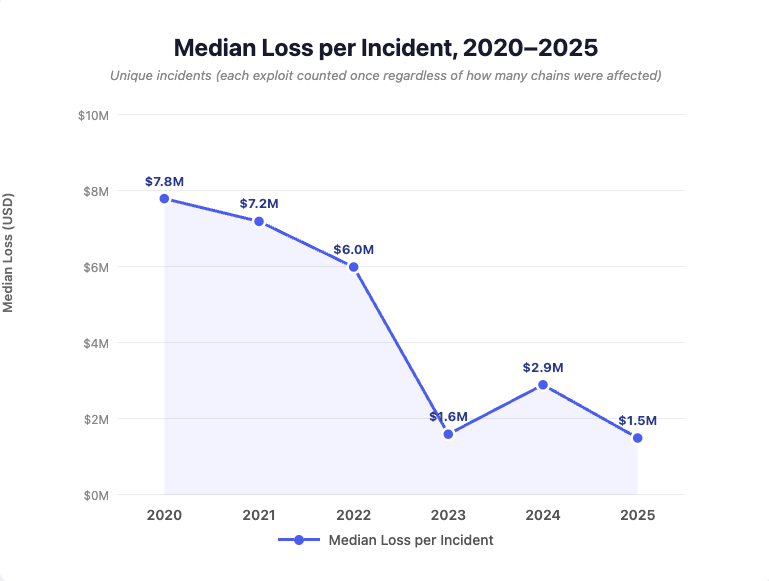
From a 2022 peak of $2.62 billion, industry-wide DeFi protocol losses fell 80% to $534 million in 2024. The 2025 figure of $680 million represents a partial rebound, but that increase is driven almost entirely by a small number of large incidents. The more telling metric is median loss per incident, which fell from $6 million in 2022 to $1.5 million in 2025, a 75% decline. The typical exploit is getting smaller despite the total number of incidents rising, and even as DeFi TVL across all ecosystems grows substantially.
That combination of rising TVL, more incidents, but lower median severity and lower total losses relative to value secured is the clearest available signal that DeFi’s security posture is improving in aggregate.
How the Threat Landscape Has Changed
The types of attacks that dominate DeFi protocol losses have changed throughout this time. Understanding that shift is essential for understanding where onchain security stands now and what comes next.
Note: the classification trends in this section reflect DeFi protocol incidents only. Centralized exchange losses, including the custodial and key-management failures discussed in the disclaimer, are excluded from these figures. The threat landscape for exchanges diverged sharply in 2025 and is addressed separately below.
Attack Classification Share of Losses by Year
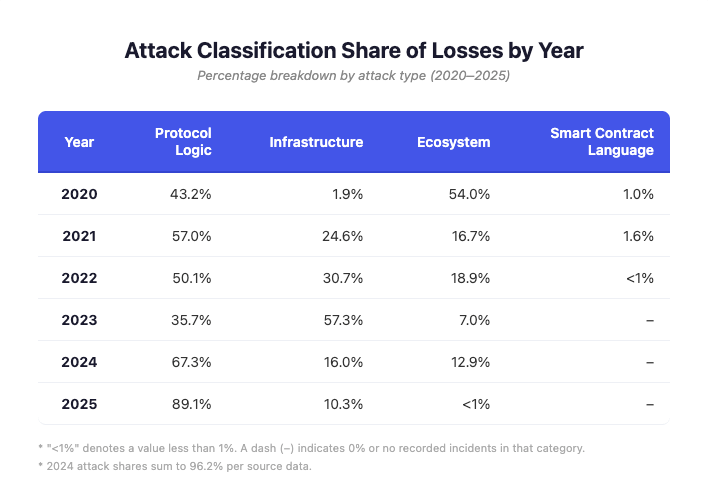
Two transitions stand out. First, ecosystem-class attacks (flash-loan oracle manipulations and reentrancy exploits affecting composability layers) have shrunk from nearly 19% of losses in 2022 to under 1% in 2025. The defenses against these attacks, including better oracle design, reentrancy guards, and improved composability patterns, appear to be working.
Second, among DeFi protocols, infrastructure failures (private-key compromises, database attacks, and operational security breakdowns) have declined from 30.7% of losses in 2022 to 10.3% in 2025. The remaining DeFi protocol losses are increasingly concentrated in protocol logic exploits: specific, often novel, code-level flaws in individual applications.
This trend does not extend to the industry as a whole. Centralized exchanges suffered over $1.6 billion in infrastructure-class losses in 2025 alone, led by Bybit’s $1.5 billion multisig phishing exploit. Including exchange losses, infrastructure failures remain the single largest loss category industry-wide. The improvement is real within DeFi protocol security; it should not be read as an industry-wide decline in operational security risk.
Within DeFi protocols, this matters because it shows a maturing security ecosystem. The easy, repeatable onchain attack patterns are getting closed off. What remains is harder for attackers: finding and exploiting unique logic flaws in individual protocols, rather than reusing known techniques across dozens of vulnerable targets. At the custodial layer, however, the oldest attack pattern of all, compromising the people who hold the keys, scaled to unprecedented levels in 2025.
Bridge Exploits: Changed in Form, Not Gone
Bridges were the defining vulnerability of 2021-2022. In 2022 alone, nine bridge exploits produced $1.9 billion in losses: Ronin Bridge ($624M), Binance Bridge ($570M), Portal/Wormhole ($326M), Nomad ($190M), Harmony Bridge ($100M), and Qubit ($80M).
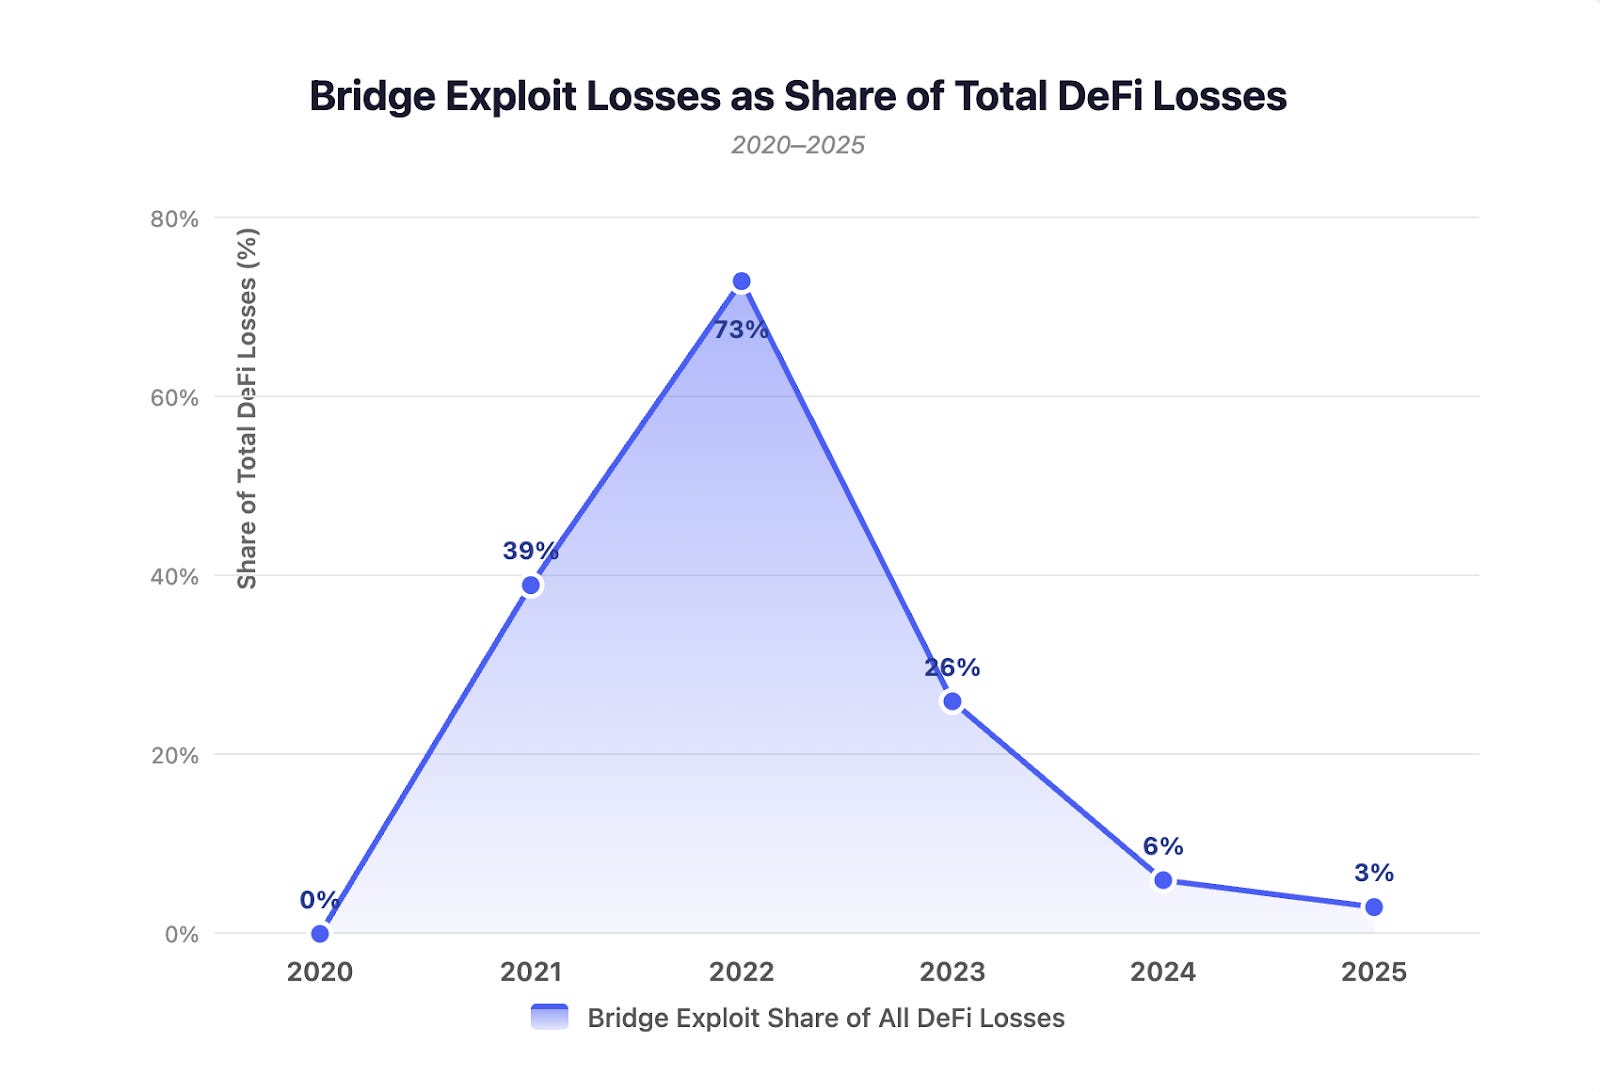
The decline is stark: from 73% of all losses in 2022 to 3% in 2025. The specific bridge architectures that failed in 2022, centralized validator sets with weak multisig thresholds, have largely been replaced or hardened.
But the underlying risk of cross-chain trust assumptions has not disappeared. It has changed shape. The KelpDAO exploit in April 2026 demonstrated this in real time: attackers drained $292 million through a LayerZero-powered bridge running a single-verifier configuration, one point of failure protecting hundreds of millions in user funds. The attack was attributed to North Korea’s Lazarus Group, the same actor behind the Ronin Bridge hack four years earlier. The resulting contagion created up to $230 million in bad debt on Aave and triggered $13 billion in DeFi TVL withdrawals within 48 hours.
The vulnerability was not exotic. At the time of the exploit, 47% of applications built on LayerZero were running the same minimal verification setup. Bridge risk did not fall. It migrated from purpose-built bridge protocols into the cross-chain messaging layers that now underpin how DeFi moves assets between chains. The next section on multi-chain exposure addresses this structural shift.
Flash Loans: From Dominant Threat to Marginal
Flash-loan attacks were the signature DeFi exploit technique of 2020-2022. They represented 54% of all losses in 2020 and remained a significant share through 2023. By 2025, flash-loan attacks accounted for less than 1% of DeFi losses.
The near-disappearance of flash-loan attacks as a major loss driver reflects genuine defensive progress: better oracle architectures (time-weighted average prices, Chainlink integration), reentrancy protections, and protocol designs that account for the possibility of atomic manipulation.
Private Key Compromises: Declining in DeFi, Concentrating in Custody
Among DeFi protocols, private key compromises were the largest single technique category in 2022 (28.7% of losses) and 2023 (32.2%). By 2025, they accounted for 8.1% of DeFi protocol losses. Fewer DeFi teams are losing keys, and the ones that do tend to lose smaller amounts.
But this trend is confined to DeFi protocols. At the exchange and custodial layer, private key compromises had their worst year in history. Bybit lost $1.5 billion through a multisig phishing exploit. Phemex lost $85 million, CoinDCX $44 million, and BtcTurk $48 million, all to key compromises in 2025 alone.
The technique is not declining. It is migrating. Attackers are shifting from DeFi protocol teams, where key management has visibly improved, to centralized custodians where a single compromised signer can unlock far larger sums. The risk has concentrated, not diminished.
Multi-Chain Exposure: The New Risk Vector
One of the most important structural changes is the rise of multi-chain exploits: incidents that cascade across multiple ecosystems because the same vulnerable code or trust assumption exists in more than one place.
In 2021, multi-chain losses were dominated by Poly Network, a bridge exploit. By 2025, the defining multi-chain incident was Balancer V2’s $128 million composable stable pools exploit, which affected Ethereum, Arbitrum, Base, Polygon, Sonic, and OP Mainnet simultaneously. The flaw was in protocol logic, not in a bridge: wherever the code was deployed, it was exploitable.
This means ecosystems are no longer cleanly separable security domains. Once a chain becomes part of the default deployment map for major protocols, it inherits the risk surface of every protocol deployed on it. Multi-chain architecture, especially systems that share code, signer paths, verification assumptions, or operational dependencies across networks, increasingly deserves to be treated as its own risk class.
The Ecosystem Scoreboard
Every ecosystem participant, from developers to LPs to users, wants to know: which ecosystems are actually getting safer, and why? Here is the full picture.
DeFi Protocol Losses by Ecosystem, 2020-2025 (mult-chain incidents counted per chain)
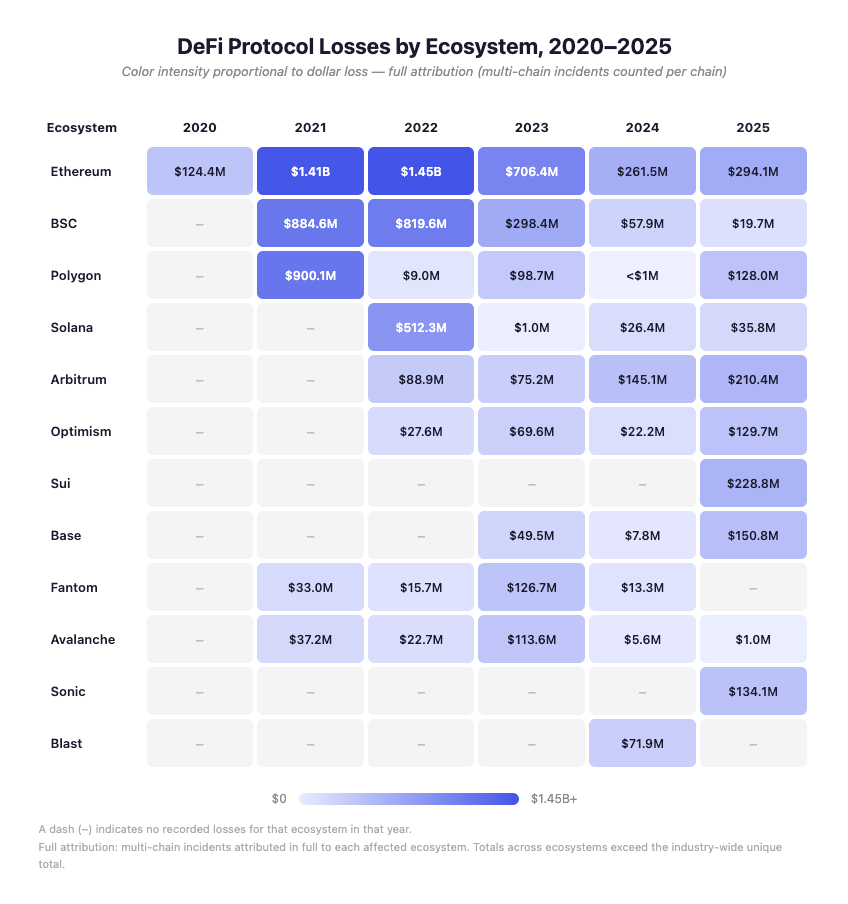
Several patterns emerge. First, the oldest and largest ecosystems (Ethereum, BSC) show clear declining loss trends in recent years despite carrying the most cumulative damage. Second, newer and faster-growing ecosystems (Arbitrum, Base) show rising loss trends, consistent with the pattern of DeFi growth outpacing defensive maturity. Third, multi-chain attribution heavily shapes the 2025 figures for several ecosystems: Polygon, OP Mainnet, Base, and Sonic all have 2025 figures dominated by Balancer V2’s cascade.
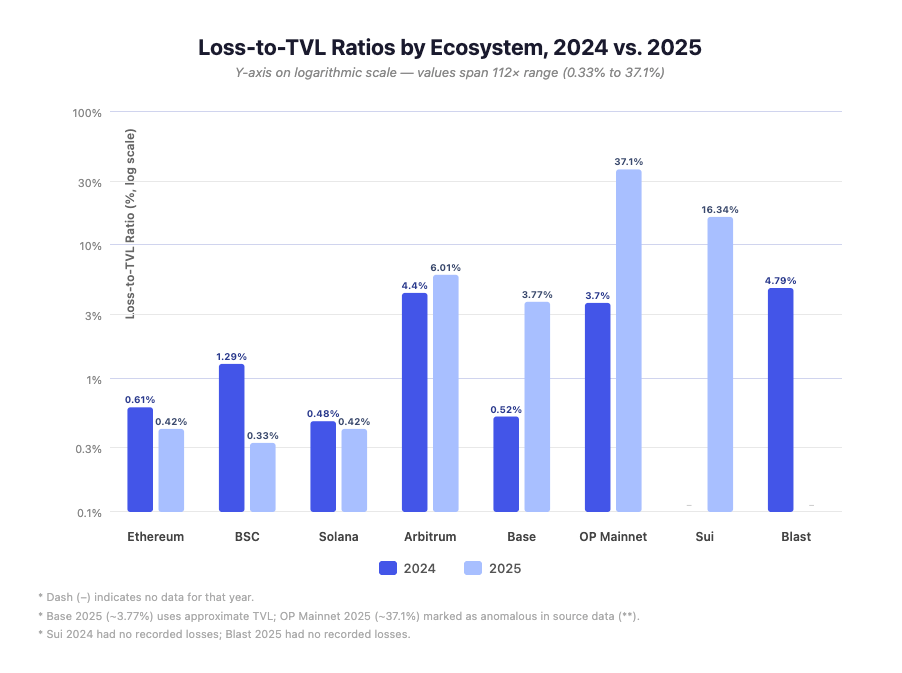
Loss-to-TVL Ratios: The True Risk Measure
Raw dollar losses are important, but they do not account for scale. A $50 million loss on a chain securing $50 billion is categorically different from a $50 million loss on a chain securing $500 million. To compare ecosystems fairly, we measure losses relative to average TVL.
Base 2025 ratio heavily influenced by Balancer V2 full attribution. Excluding that event, standalone losses were ~$23M, implying ~0.6%. *OP Mainnet 2025 figure driven overwhelmingly by Balancer V2 full attribution against a small TVL base. Standalone losses were ~$1.7M, implying ~0.49%, showing just how much a single hack can skew ecosystem hack impact.
TVL figures sourced from DeFiLlama, approximate annual averages.
On a TVL-adjusted basis, the lowest-risk tier among major ecosystems in 2025 consists of Ethereum (~0.42%), Solana (~0.42%), and BNB Chain (~0.33%). These are the three largest DeFi ecosystems by TVL, and they demonstrate that scale and security can improve together.
Note: OP Mainnet figures reflect OP Mainnet TVL only. The broader OP Superchain has a significantly higher combined TVL, but aggregating it here would double-count Base and obscure each chain’s individual risk profile.
What Drives Improvement
The ecosystems that show the strongest security improvement share common characteristics. Their loss-to-TVL ratios declined because TVL grew while losses held steady or fell, meaning security scaled with adoption rather than falling behind it. Several factors appear to correlate with this improvement across the dataset.
Sustained investment in auditing and bug bounty programs creates a continuous pressure toward vulnerability discovery before exploitation. Ecosystem-level upgrades that address known vulnerability classes can close off entire categories of attack. Maturation of common building blocks, including better oracle designs, battle-tested reentrancy guards, and standardized access-control patterns, eliminates the repeat-attack patterns that dominated early DeFi.
The data also shows that within DeFi protocols, the types of exploits that remain are increasingly novel and protocol-specific. In 2025, 89% of DeFi protocol losses came from protocol logic exploits, the hardest category to defend against systematically because each one exploits a unique flaw in a specific application. This is what progress looks like in onchain security: the generic attacks get solved, and what remains is the long tail of application-specific risk. The caveat is that this progress has not reached the custodial layer, where the generic attack, social engineering key holders, produced the largest single loss in crypto history the same year.
What This Data Means for What Comes Next
This dataset is evidence that DeFi protocol security works and is getting better. Not uniformly, not everywhere, and not fast enough, but the aggregate trajectory is unmistakable. From $2.62 billion in losses in 2022 to $534 million in 2024, DeFi protocols reduced exploit-driven losses by 80% in two years. The 2025 rebound to $680 million does not reverse that progress: it reflects the growing complexity of multi-chain deployments and a small number of high-severity incidents, not a broad regression.
The picture outside DeFi protocols is less encouraging. Centralized exchange and custodial losses exceeded $1.8 billion in 2025, driven by private key compromises at scale. And early 2026 has already demonstrated that both cross-chain and operational risks remain live: the KelpDAO bridge exploit drained $292 million through a single-verifier LayerZero configuration, while the Drift Protocol hack on Solana, a $285 million loss attributed to a six-month North Korean social engineering operation that combined governance manipulation with oracle exploitation, showed that sophisticated state actors are now running long-term infiltration campaigns against DeFi teams directly. The industry’s overall security posture is improving in some layers and deteriorating in others. DeFi’s progress is real, but it is not the whole story.
The deeper pattern across six years is not chain versus chain. It is DeFi’s protocol layer learning, adapting, and building stronger defenses under sustained adversarial pressure ,and the data shows that those defenses are working. The next frontier is whether the custodial and cross-chain messaging layers can achieve the same trajectory, because right now, they have not.
The data used in this analysis was sourced from DefiLlama and covers the period from 2020 through 2025. The dataset includes 460 incidents across those years, with the most complete coverage in 2021–2025. TVL figures referenced throughout the report are approximate annual averages, also sourced from DefiLlama.