
The Real Cost of an Onchain Hack: 2024-2025 Update

Summary
In 2023, we published our first comprehensive analysis of the true cost of onchain hacks, covering the 2021 to 2023 period. That analysis produced Amador’s Hack Impact Estimate, a framework for quantifying what a hack actually does to a project beyond just the stolen funds. Two years later, we have new data, and the picture has shifted in important ways.
Updated hack impact estimate for 2024-2025: If your protocol suffers a hack today, the data suggest you will lose roughly $25,000,000 USD in direct theft, watch your token shed 61% of its value over the following six months, and face sustained price depression that 84% of hacked tokens never recover from within that window. The organizational toll remains unchanged: expect at least 3 months of lost productivity, roadmap delays, and team disruption.
The headline numbers tell a story of an industry that is maturing but still deeply vulnerable. The overall count of hacks has stayed high. The median theft per incident has dropped. But the largest exploits have grown even larger, and the market punishment for getting hacked has become more severe, not less.
What changed since 2021-2023?
Our original study covered 234 publicly known hacks across three years, totaling $7.2 billion in stolen funds. The 2024-2025 dataset now adds another 191 hacks, totaling $4.67 billion. Taken together, that gives us 425 hacks and $11.9 billion in damage across five years of onchain security incidents.
A few high-level shifts stand out.
The frequency of hacks has plateaued at a high level. In 2024, there were 94 known hacks, and in 2025, there were 97. For comparison, 2021 saw 71, 2022 saw 66, and 2023 saw 97. The industry is not seeing fewer exploits year over year. If anything, the number of incidents has settled into a steady, elevated baseline.
The median hack has gotten smaller, but the tail risk has gotten worse. The median theft during 2024-2025 was $2,200,000, roughly half the $4,500,000 median from 2021-2023. That might sound like progress, but it is misleading. The average theft in 2024-2025 was $24,500,000, which is 11.1 times the median. In the earlier period, the ratio was 6.8 times. That widening gap reflects a power law distribution that has become even more extreme. A small number of catastrophic exploits now account for a disproportionate share of total damages.
The concentration at the top is staggering. The five largest hacks in 2024-2025 accounted for 62% of all funds stolen. The ten largest accounted for 73%. At the very top, the Bybit exploit alone, at $1.5 billion, represented 44% of all funds stolen in 2025 and 32% of the entire two-year total.
Funds stolen
Over 2024-2025, the 191 publicly known hacks impacted a combined $4,670,000,000 USD. Breaking that down by year: $1.27 billion was stolen in 2024 across 94 incidents, and $3.4 billion was stolen in 2025 across 97 incidents.
The year-over-year jump in 2025 is substantially attributable to a handful of massive exploits. Remove the Bybit hack and 2025’s total drops to roughly $1.9 billion, still a significant figure that underscores the breadth of the problem even outside the largest single incident.
The average hack in 2024-2025 resulted in the theft of $24,450,550 USD. The median hack resulted in the theft of $2,200,000 USD.
Compared to 2021-2023, the average has dropped from $30.8 million to $24.5 million, and the median has dropped from $4.5 million to $2.2 million. Both shifts suggest that the typical hack is extracting less value than before. But this is cold comfort when a single Bybit-scale event can wipe out in one afternoon what two dozen smaller hacks would take months to accumulate.
The power law distribution we identified in our original analysis has only become more pronounced. Many hacks are small. But the catastrophic ones are now larger than anything the 2021-2023 period produced.
Where the money went: Centralized exchanges accounted for just 20 of the 191 hacks in 2024-2025, but those 20 incidents were responsible for $2.55 billion, or 54.6% of total stolen funds. DeFi protocols and other targets made up the remaining 171 hacks but accounted for 45.4% of the dollar volume. The Bybit, DMM Bitcoin, WazirX, and BtcTurk exploits alone demonstrate that centralized custodial risk remains one of the most consequential attack surfaces in crypto.
Market impact
In our 2021-2023 study, we covered 176 hacks with token price data and found a median six-month decline of 53%. For this update, we tracked 82 hacked tokens across 2024-2025 and measured their price performance at five time intervals after the exploit.
The updated numbers:
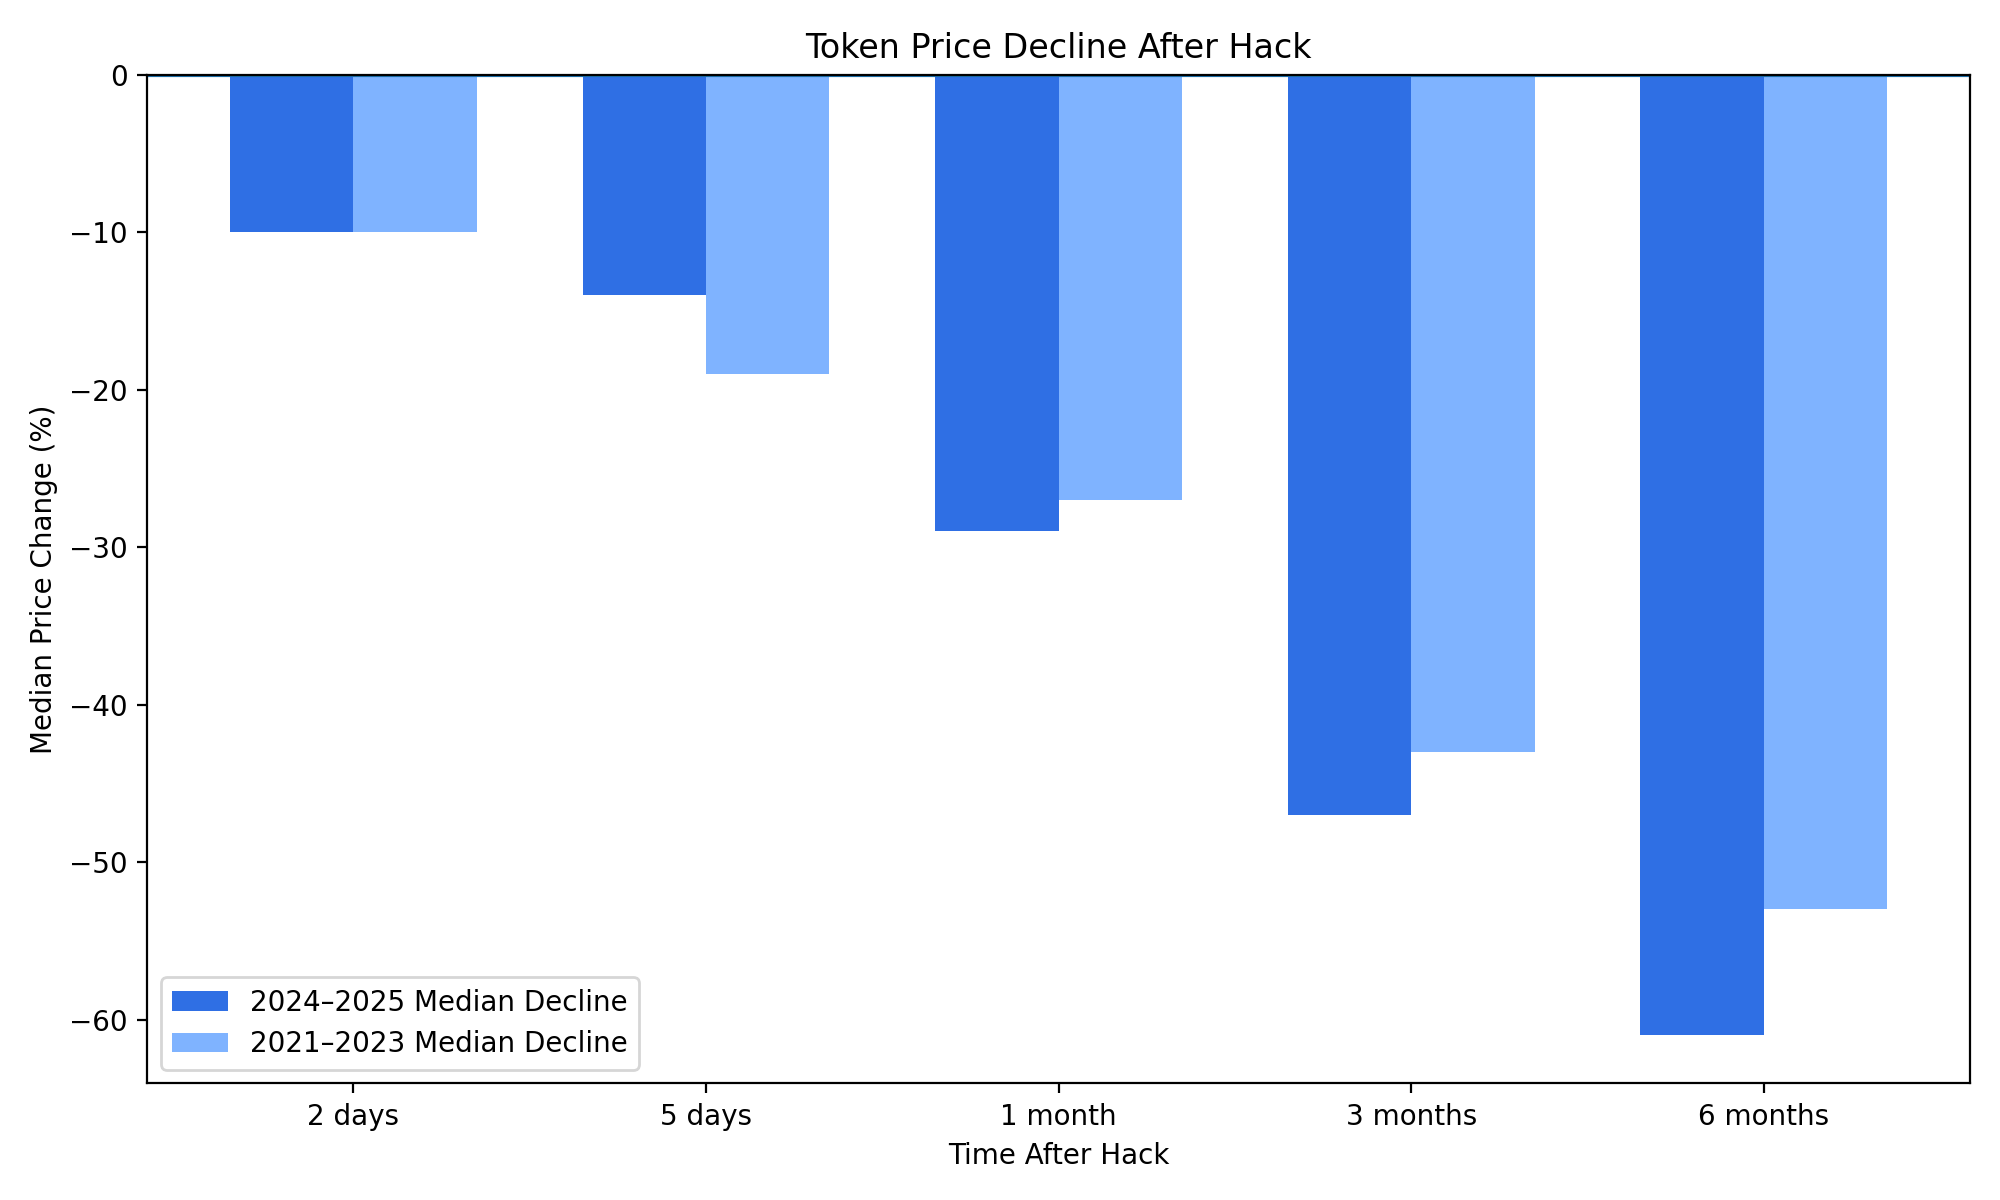
The initial shock is roughly the same. Within two days, a hacked token drops about 10% at the median, consistent with the earlier period. But from that point forward, the 2024-2025 data tells a darker story. The six-month median decline has worsened from 53% to 61%. That is a meaningful shift. It suggests that the market has become less forgiving of security failures, not more.
Looking at the severe end of the distribution, the numbers are equally grim. At the three-month mark, 47.3% of hacked tokens had lost more than half their value, and 8.1% had lost over 90%. At six months, 56.5% were down more than 50%, and 14.5% were down more than 90%.
Perhaps the most telling statistic: 83.9% of hacked tokens showed sustained price suppression six months after the exploit. That is up from 77.8% in the 2021-2023 data. Only about 16% of hacked tokens managed to trade above their hack-day price six months later.
In the previous analysis, we noted that market impact likely continues to intensify beyond six months. The 2024-2025 data confirms this suspicion. The decay curve does not flatten at six months. It steepens. Whatever trust a token commanded before the hack, the market extracts a lasting penalty that compounds over time.
The caveat from our original analysis still applies: we cannot fully isolate hack impact from broader market conditions. A token that fell 61% over six months may have been affected by sector-wide drawdowns, project-specific governance failures, or other factors. But the consistency of the pattern across 82 different tokens, in both bull and bear conditions, strongly suggests that hack-driven damage is the primary force at work.
What this means practically: Most token projects rely on their liquid tokens as treasury reserves and growth capital. A 61% median decline in token value translates directly into a 61% reduction in a project’s financial runway, its ability to hire, its capacity to fund development, and its leverage in partnerships. The market impact of a hack is not an abstract price chart problem. It is an operational crisis that compounds the direct theft.
Dependency and organizational impact
Our original analysis described dependency impact (second-order effects on interconnected protocols) and talent/organizational impact (lost time, personnel turnover, and roadmap disruption). These categories remain difficult to quantify with precision, but the 2024-2025 period offers additional evidence for how severe they can be.
On the dependency front, the growing interconnection of DeFi protocols has expanded the blast radius of individual exploits. Cross-chain bridges continue to represent systemic risk. Liquid staking tokens, restaking derivatives, and composable lending markets have created new dependency chains that did not exist during the 2021-2023 period. When a protocol at the base of one of these dependency stacks is compromised, the cascade of damage can extend far beyond the initial exploit.
The collapse of Elixir’s deUSD stablecoin in November 2025 illustrates this dynamic with painful clarity. When Stream Finance disclosed a $93 million loss from an external fund manager, the damage did not stop there. Elixir had parked roughly 65% of deUSD’s collateral with Stream. As Stream’s own stablecoin xUSD dropped 77%, deUSD’s backing effectively vanished. What followed was a textbook dependency cascade: Stream froze withdrawals, deUSD redemptions halted, panic selling hit Curve pools, and over $30 million was dumped onchain as holders raced to exit. deUSD ultimately lost more than 97% of its value, and Elixir was forced to sunset the stablecoin entirely, coordinating with Euler, Morpho, Compound, and other protocols to manage the liquidation process. A single loss event at one protocol cascaded through collateral dependencies to destroy a stablecoin and disrupt multiple lending markets.
On the organizational side, the pattern we described in 2023 has held steady. Hacked projects consistently lose their security leadership within weeks of the incident. The recovery period consumes at minimum three months of focused effort. Core product development stalls. Hiring becomes harder as the hack signals weakness to prospective talent.
The estimate remains: if you get hacked, expect to lose at least 3 months of forward progress to remedial security work, leadership turnover, and organizational recovery.
Updated estimate: the total cost of a hack in 2024-2025
Bringing the numbers together, here is the updated picture:
The average hack steals $24,500,000 USD at the moment of exploit. The median is $2,200,000, but the distribution is heavily skewed toward rare, massive events.
The median hacked token loses 61% of its value within six months, up from 53% in the 2021-2023 period. 84% of hacked tokens show sustained price depression six months post-hack, up from 78%.
Dependency risks have grown as DeFi composability has deepened, expanding the potential blast radius of any single exploit.
The organizational cost remains roughly 3 months of lost time and effort, consuming the team’s attention, delaying the product roadmap, and often costing the project its security leader.
The updated Amador’s hack impact estimate: if your protocol gets hacked today, expect to lose approximately $25,000,000 USD, see your token price decline by 61% over six months, face an 84% probability that your token price never recovers within that window, and burn at least 3 months of organizational effort on response and remediation.
What the data tells us about the state of onchain security
The comparison between the two periods reveals a mixed picture. On one hand, the median theft per hack has declined, which may reflect the gradual maturation of smart contract security practices, more widespread auditing, and the growth of bug bounty programs. On the other hand, the market punishment for getting hacked has grown harsher, the concentration of damage among the largest exploits has intensified, and the overall number of hacks remains stubbornly high.
The industry has not yet solved the security problem. It has shifted its shape. Smaller exploits are somewhat less damaging than they were three years ago. But the largest exploits are now enormous, and the market has become less willing to give hacked projects the benefit of the doubt.
This has a clear implication for how protocols should think about security investment. The question is not whether your protocol can survive a typical hack. The question is whether your protocol can survive being in the tail of the distribution, because the tail is where the real destruction happens.
Closing thoughts
The initial theft is the start of the damage, not the end. Behind every headline number sits a longer, quieter story of collapsing token prices, evaporating treasuries, departing team members, and roadmaps that never get built. The 2024-2025 data makes this even clearer than the 2021-2023 data did.
The only durable defense is sustained investment in security at every layer: rigorous code review, comprehensive auditing, active bug bounty programs, and the continued development of better automated detection and prevention tools. A new onchain security stack is forming, and it works, but only if protocols adopt it.
That is the work we are doing at Immunefi: building effective security across the full onchain stack, so that hacks stop being an inevitability and start becoming a rarity.